PIZZA STORE SALES REPORT
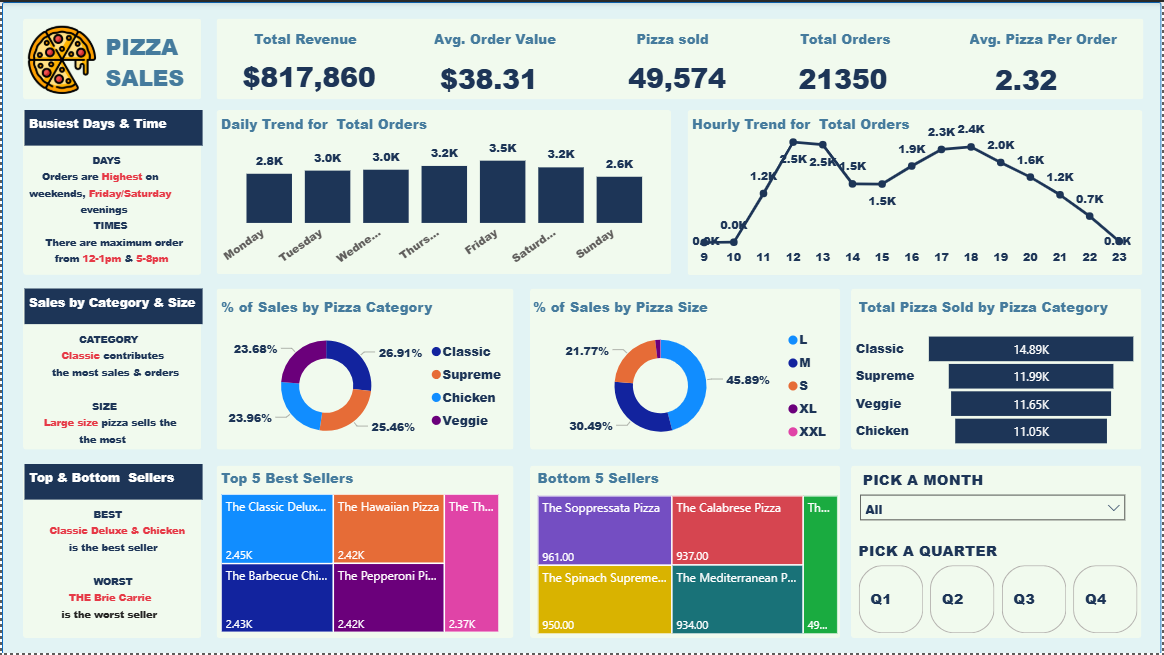
This Pizza Sales dashboard offers a comprehensive view of critical business metrics, showcasing total revenue of $817,860 from 21,350 orders, with an average order value of $38.31. It effectively visualizes key performance indicators such as the busiest days (Friday/Saturday/Sunday) and times (12-1 PM & 5-6 PM), along with a detailed breakdown of sales by pizza category (Classic, Supreme, Chicken, Veggie) and size (L, M, S, XL, XXL). Furthermore, the dashboard pinpoints top-selling items like The Classic Deluxe Pizza and The Hawaiian Pizza, while also identifying underperformers such as The Brie Carrie, providing actionable insights for inventory management and marketing strategies..
The creation of this insightful dashboard involved a meticulous multi-step process. Initially, raw sales data underwent thorough review and cleaning in Excel to ensure accuracy and consistency. Following this, SQL was leveraged to calculate key performance indicators (KPIs) and extract essential insights from the refined dataset, establishing the foundation for meaningful analysis. Finally, Power BI was utilized to transform these processed insights into the interactive and visually compelling dashboard seen here, facilitating intuitive data exploration and reporting for informed business decisions.